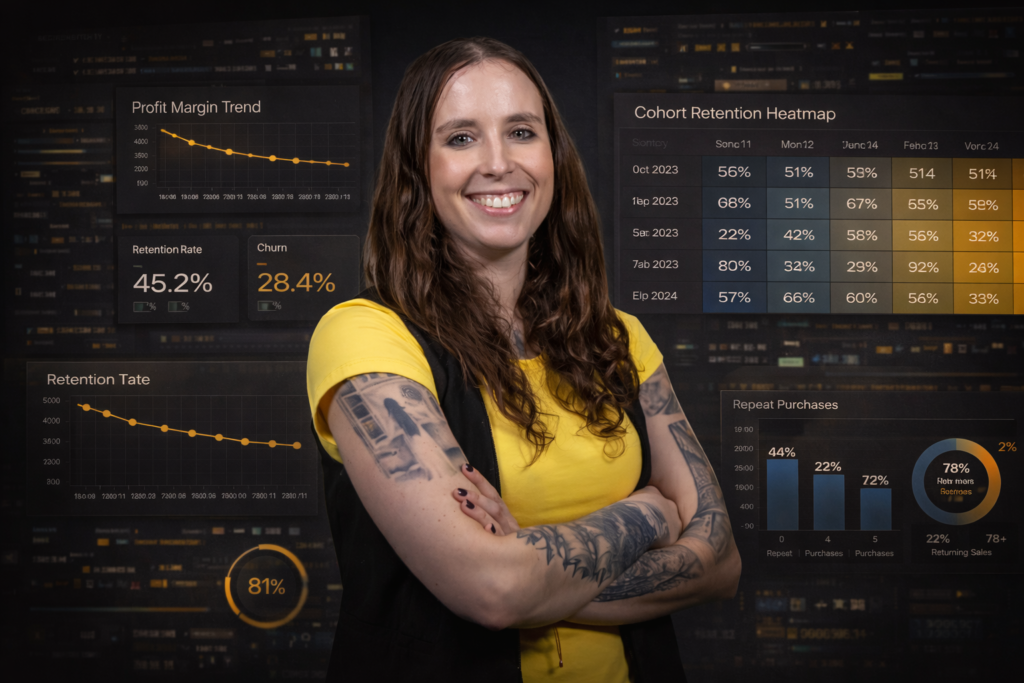
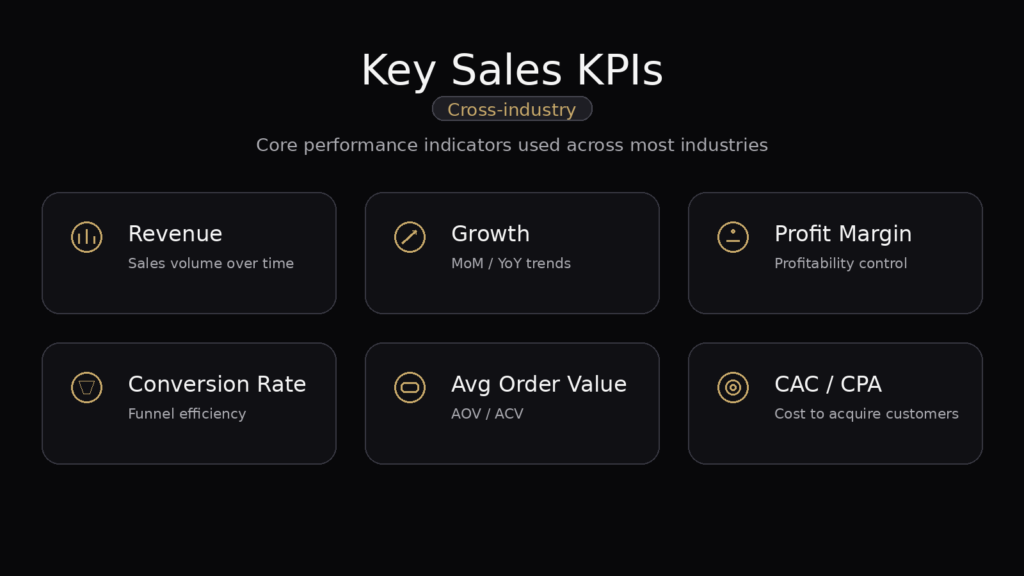
Sales Performance Experience:
Sales KPIs measure revenue, growth and profitability across industries, Tracked over YTD, YoY, MoM trends, they drive better decision-making.
Other analysis:
Revenue Trends (YTD / YoY / MoM)
Sales Funnel & Conversion Rate
Pipeline Health & Velocity
Win/Loss Analysis
Sales Cycle Length (by segment / channel)
Customer Segmentation (RFM / CLV tiers)
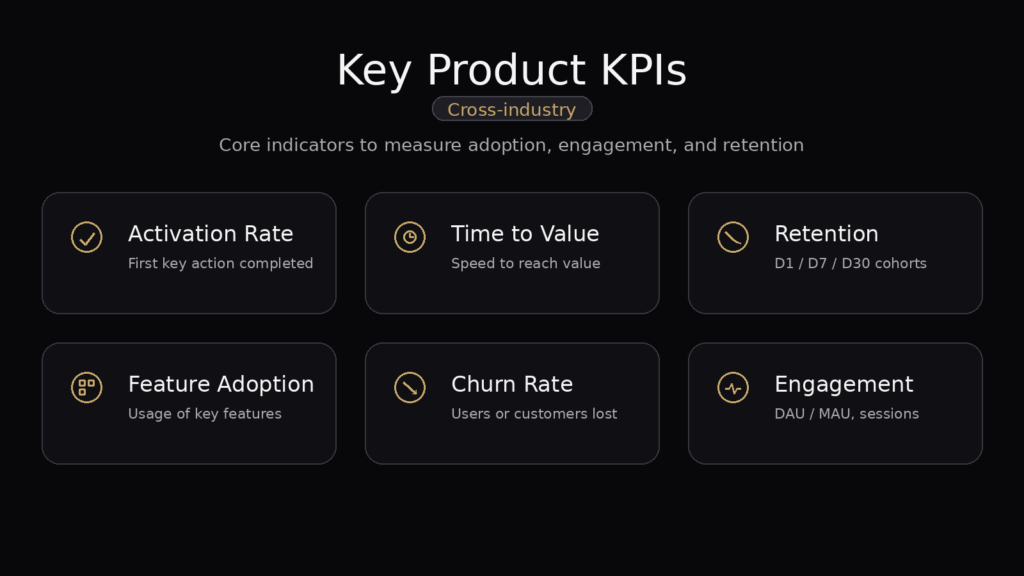
Product Performance Experience:
Product KPIs & Reporting focus on tracking how users adopt and engage with a product—measuring activation, retention, feature usage, and churn.
Other analysis:
Work example:
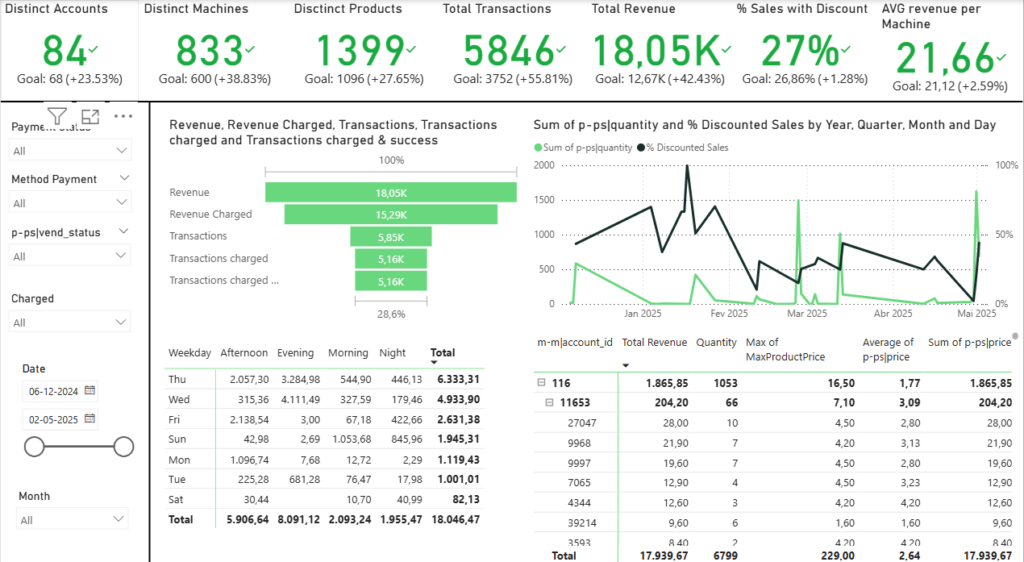
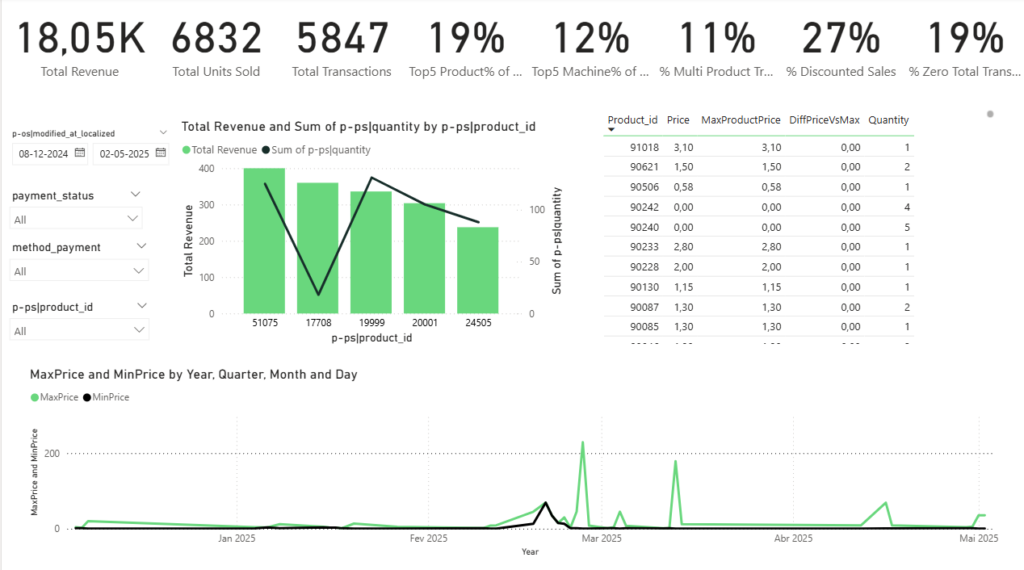
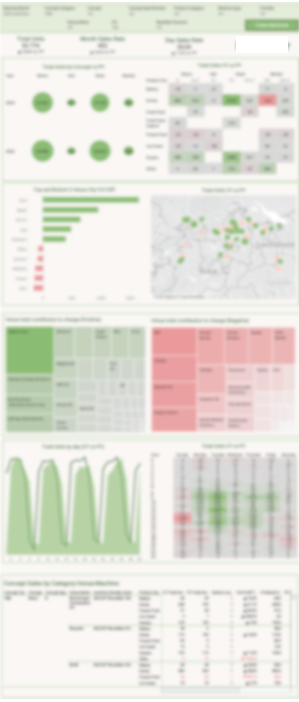
Sales & Product Performance Dashboard (YoY Benchmarking)
Built a Power BI dashboard to identify top venues and best-performing products, using YoY heatmap comparisons and contribution analysis to highlight growth drivers and underperforming areas.
Note: The dashboard is intentionally blurred to protect confidential business data.
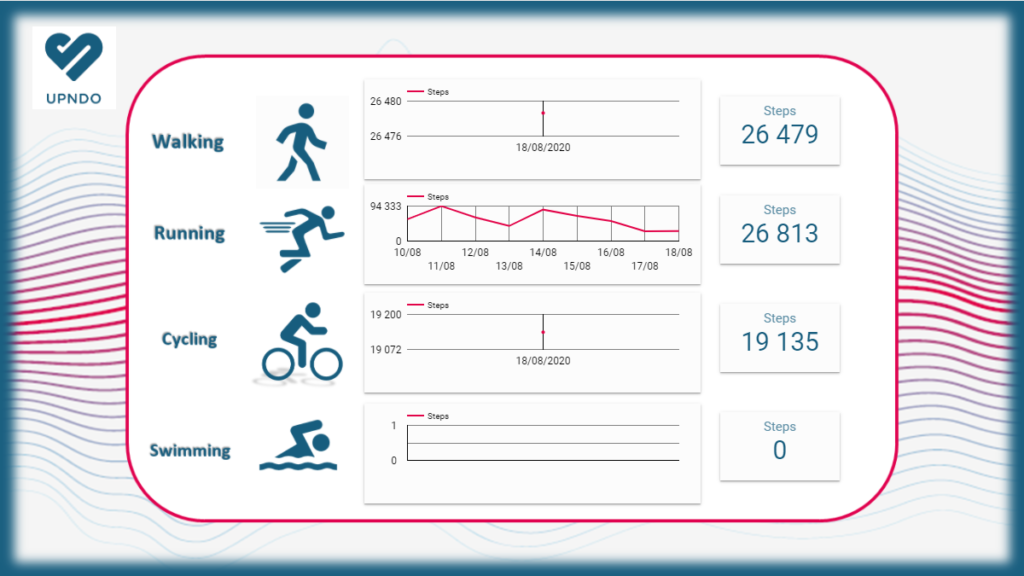
User Activity Tracking Dashboard (Product Analytics)
Built a dashboard to monitor user activity across multiple workout types (walking, running, cycling, swimming), tracking daily trends and total steps to support engagement insights and behavior analysis.
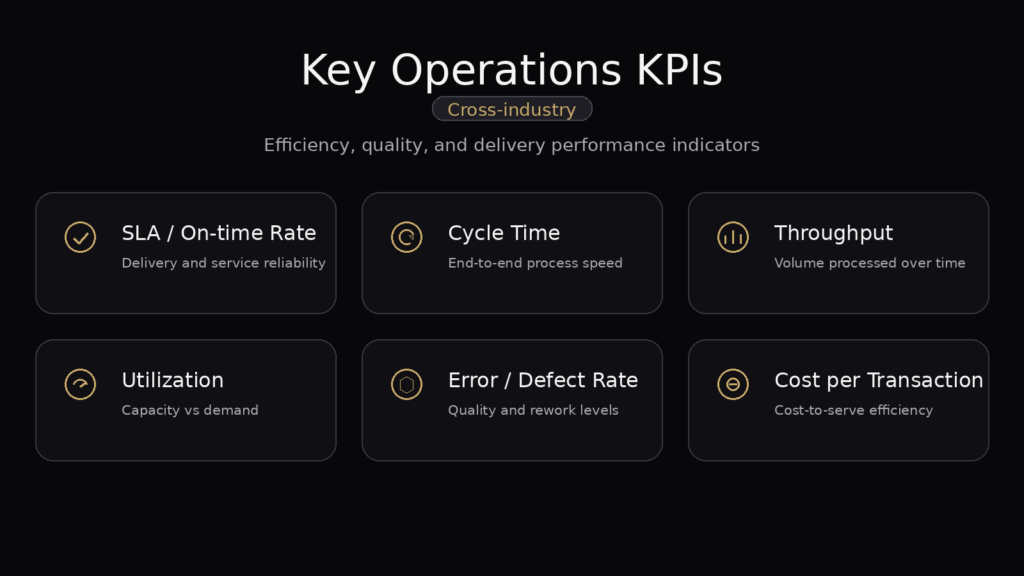
Operations Efficiency Experience:
Experience monitoring operational KPIs such as SLA, cycle time, bottlenecks, quality metrics, and cost-to-serve to improve efficiency and performance.
Other analysis:
SLA / On-time Performance
Cycle Time & Process Bottlenecks
Throughput & Capacity Utilization
Error Rate / Quality Metrics (rework, defects)
Cost-to-Serve / Cost per Transaction
Backlog & Workload Trends
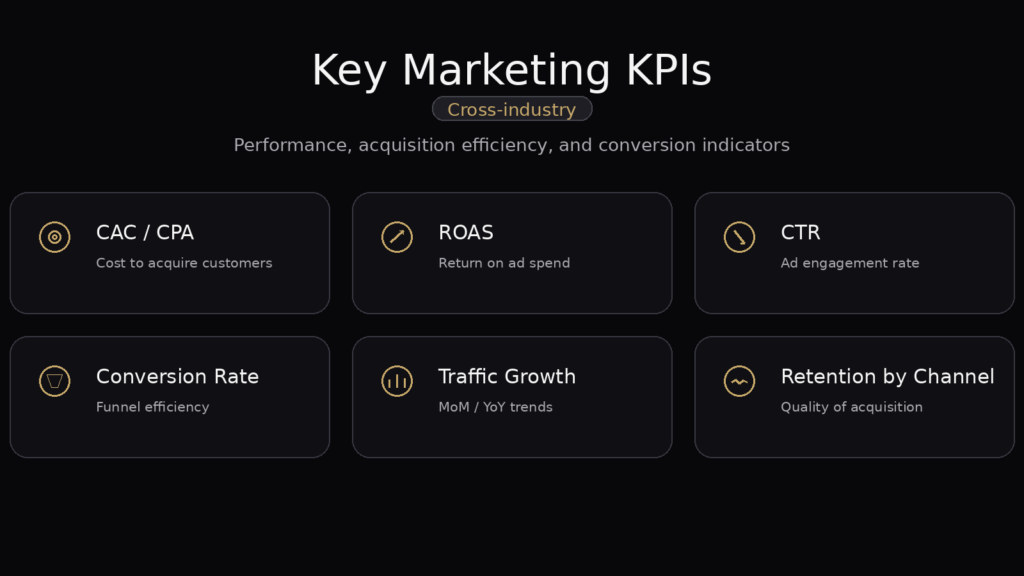
Marketing Performance experience:
Other analysis:
Channel Performance & ROI (CAC / CPA / ROAS)
Funnel Conversion & Drop-off
Attribution & Assisted Conversions
Campaign Performance & Incrementality
Customer Acquisition Trends (YoY / MoM)
Retention by Channel (cohorts + quality of traffic)
Work example:
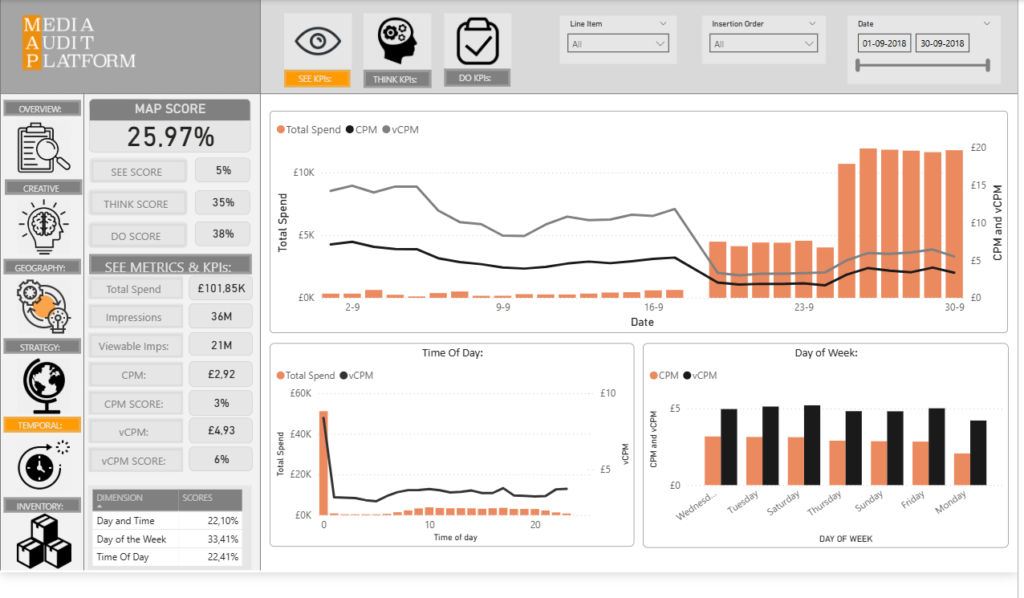
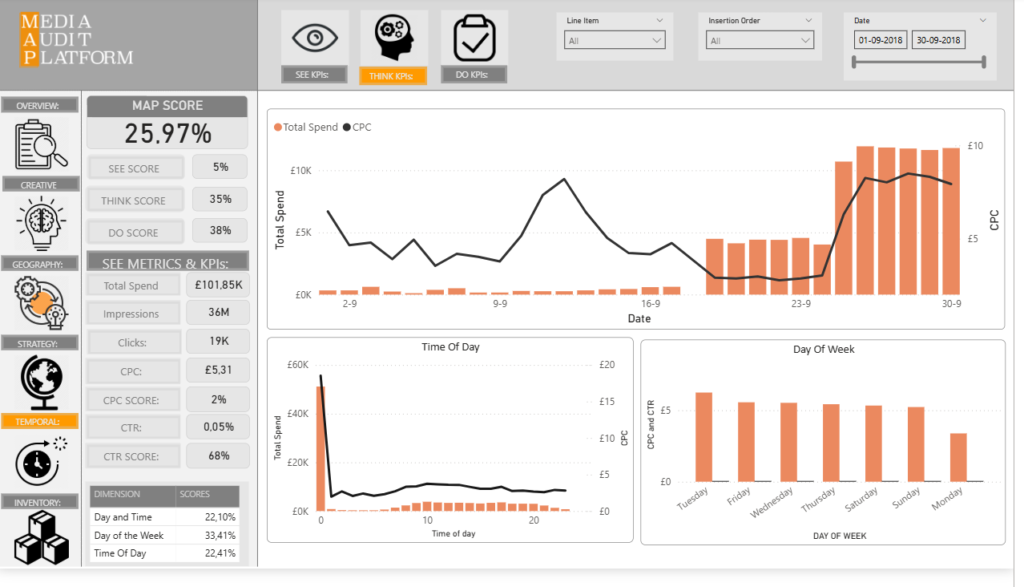
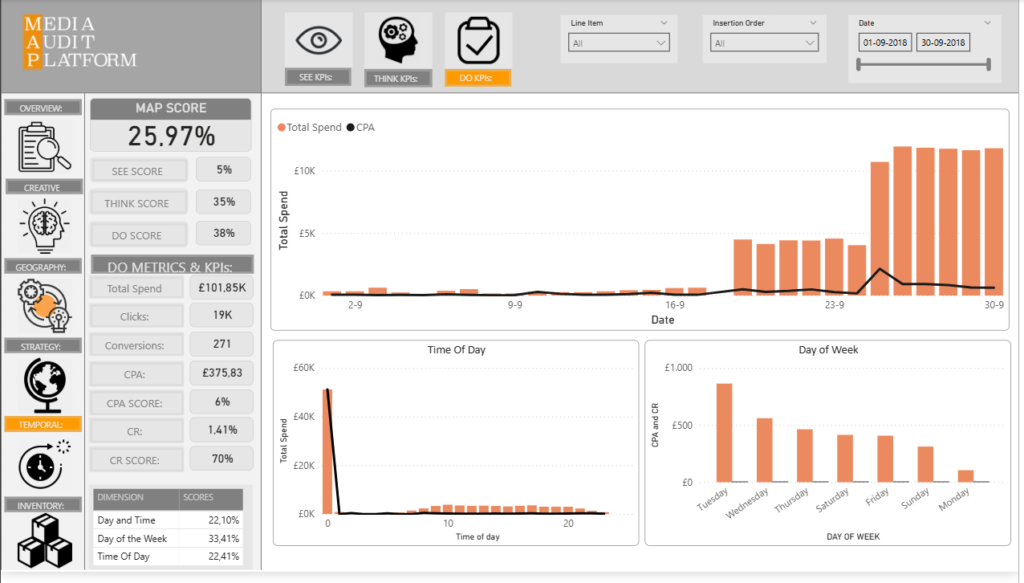
Media Audit Platform (SEE / THINK / DO KPIs):
Built an interactive media performance dashboard that audits campaigns using SEE/THINK/DO KPI layers, with drill-downs by creative, geography, inventory, and time to identify inefficiencies and optimization opportunities.
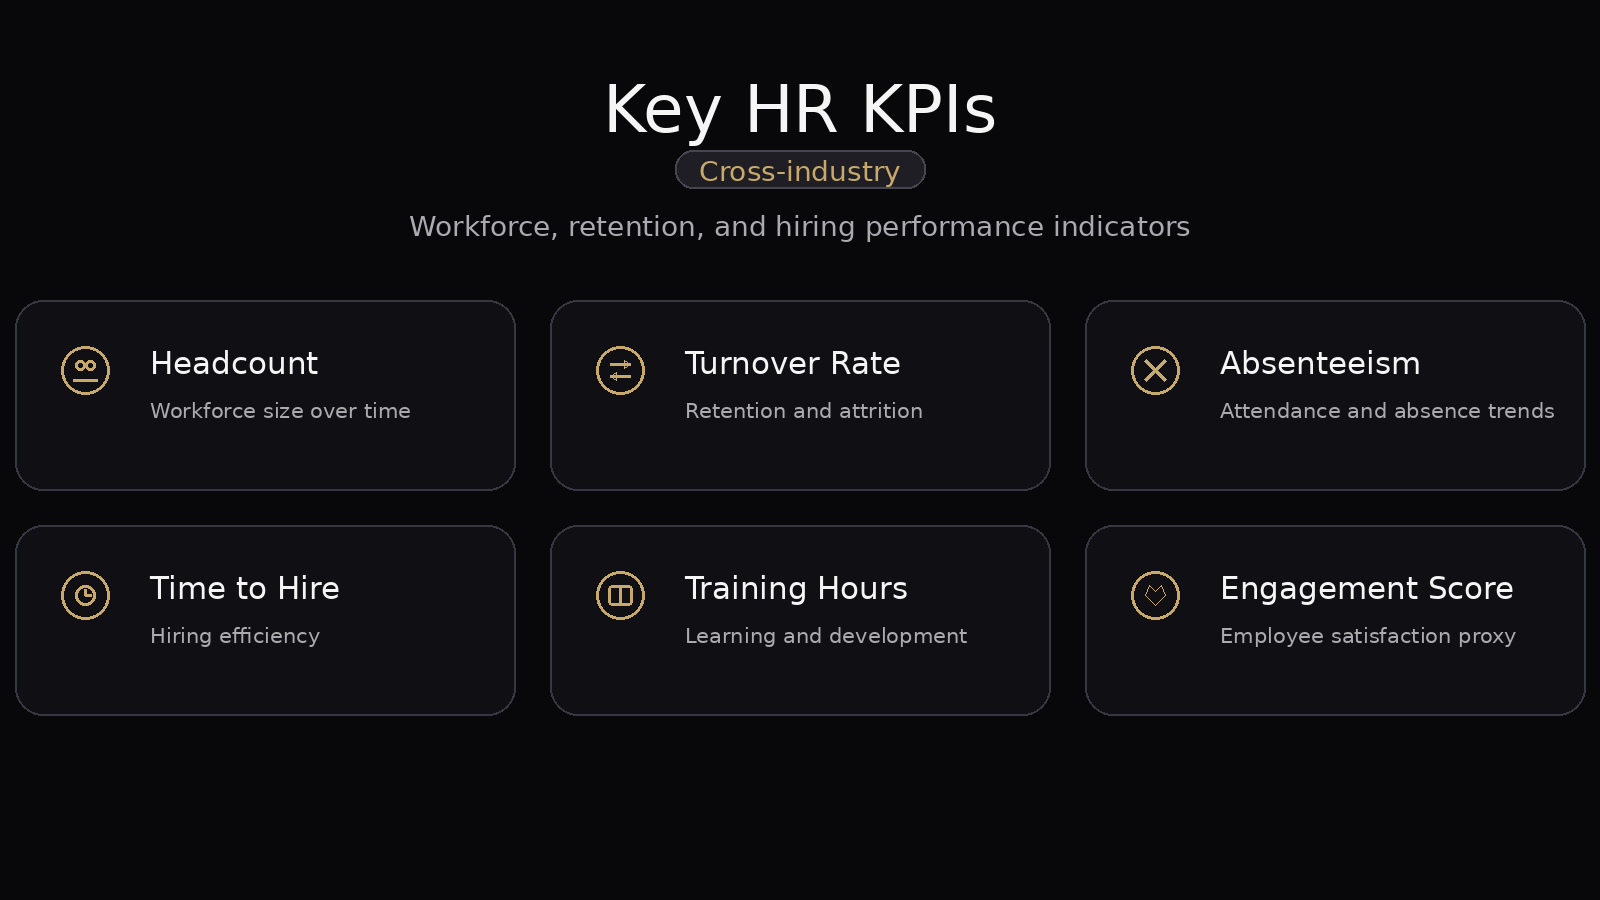
Human Resources Performance experience:
Experience building HR dashboards to track headcount, hiring and exits, turnover, absenteeism, and training hours—supporting workforce planning and retention decisions.
Other analysis:
Hiring Funnel Performance (applications → interviews → hires)
Time-to-Hire & Time-to-Fill
Employee Retention & Attrition Drivers
Performance & Productivity Metrics
Absenteeism & Attendance Trends
Workforce Planning (headcount, capacity, costs)
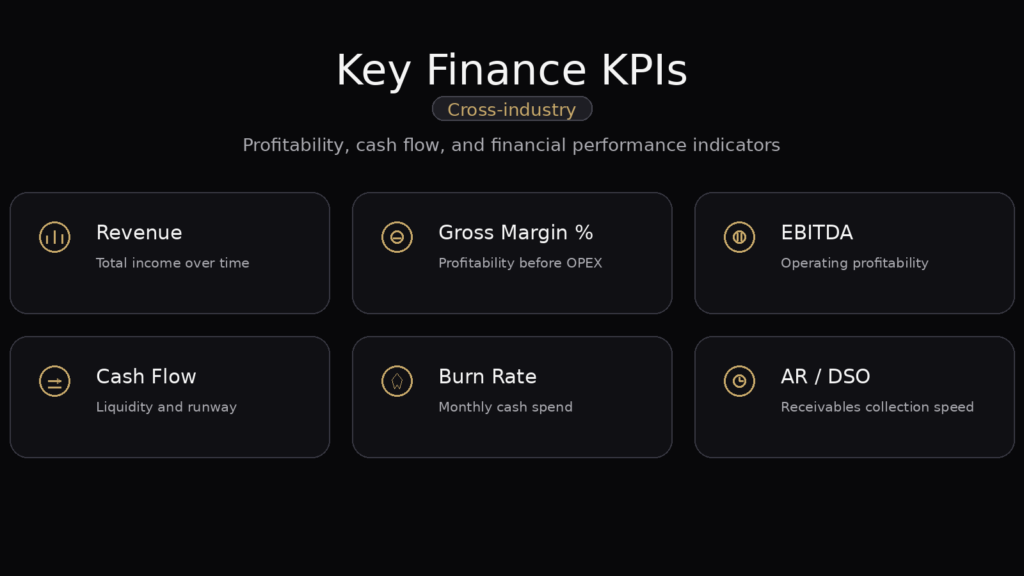
Finance Performance experience:
Experience building finance dashboards to track revenue, margins, profitability (EBITDA), cash flow, and receivables performance—supporting better forecasting, cost control, and financial decision-making.
Other analysis:
Budget vs Actuals (Variance Analysis)
Forecasting & Forecast Accuracy
Cash Flow & Runway Tracking
Revenue & Margin by Segment (product/customer/channel)
Cost Drivers & OPEX Breakdown
AR Aging & DSO (collections performance)
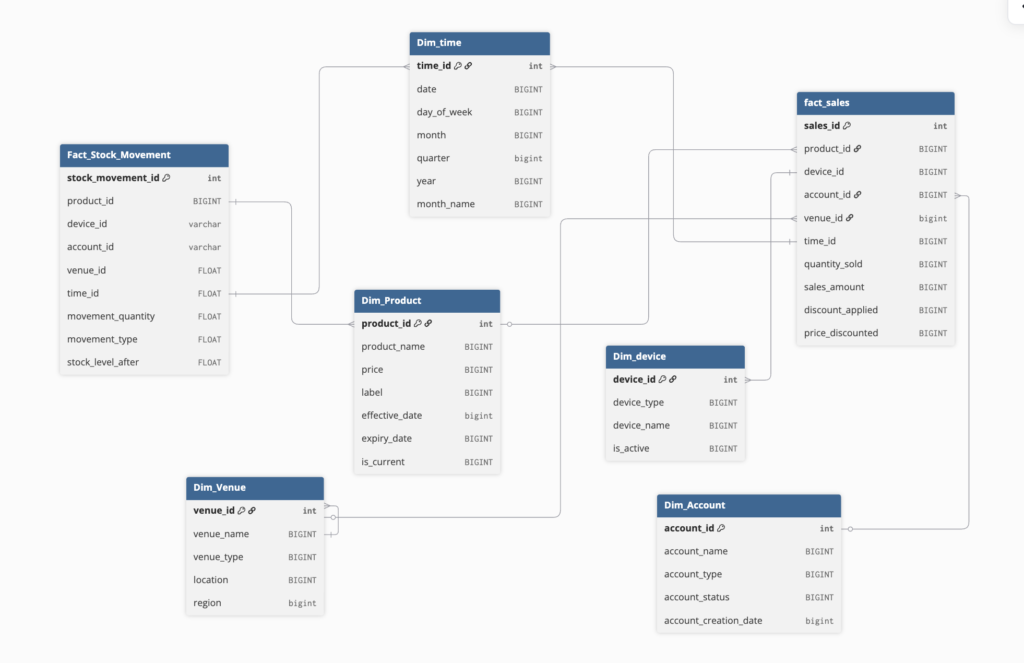
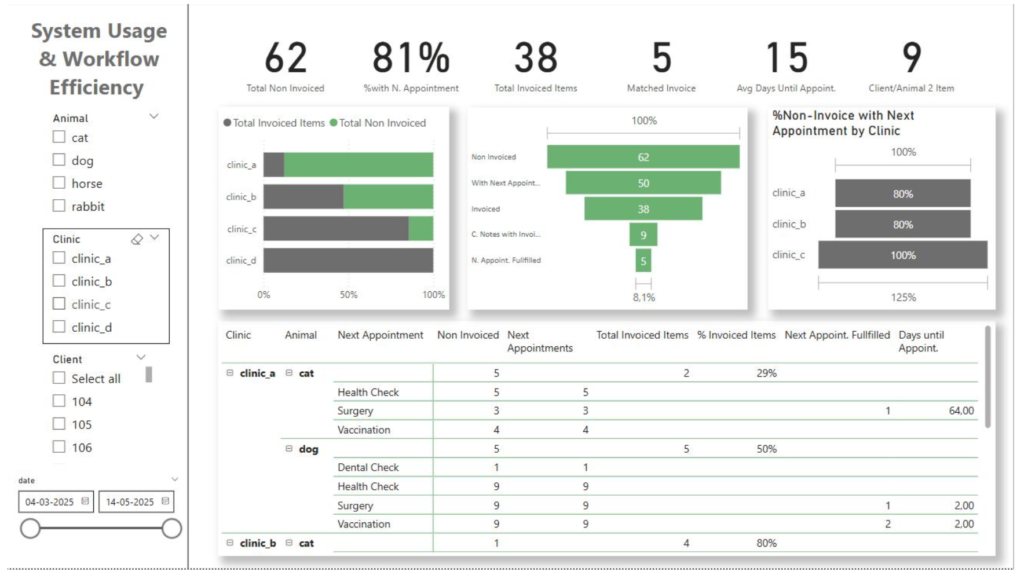
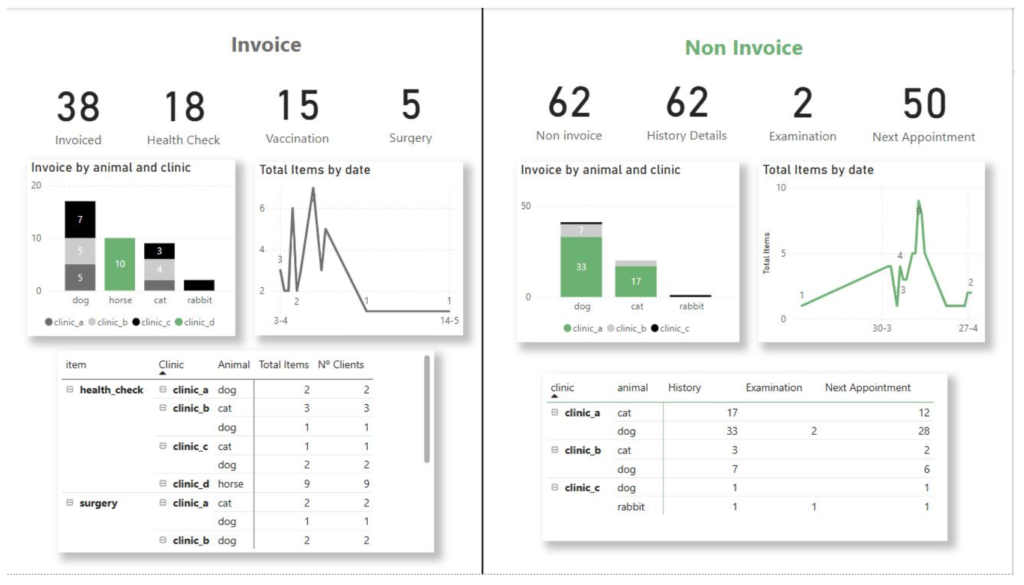
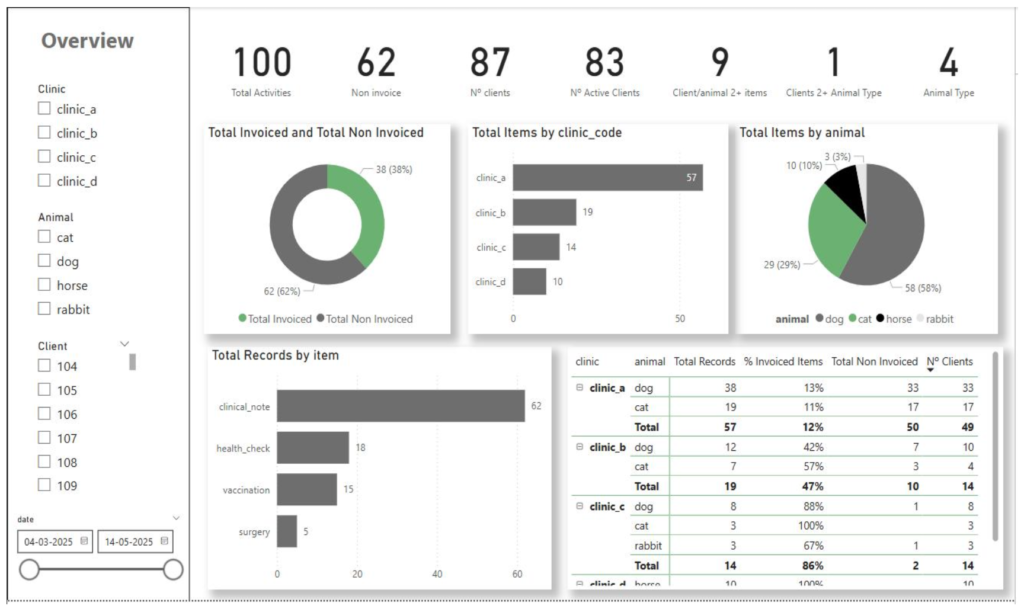
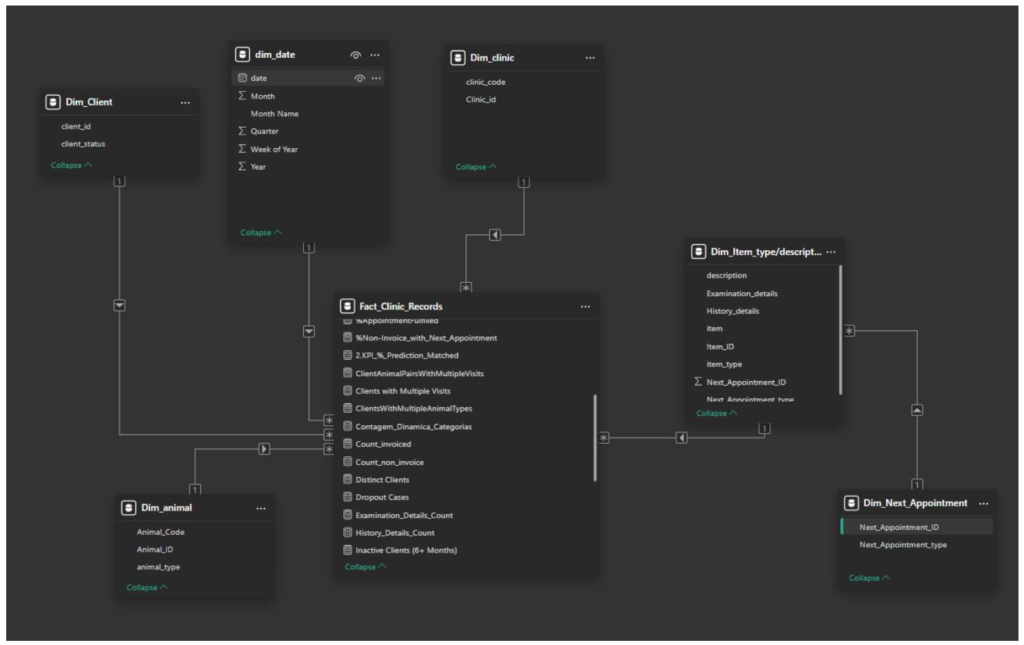
Vet clinic – snowflake schema:
Retail Product and Sales – star schema: